LEAFIO Logistic solutions
Product Demo
Key takeaways
- 1:03The standard dashboard highlights operational inefficiencies such as late visits and dwell time, and its example records route overruns of approximately 5%.
- 2:03Plan-versus-actual analysis compares mileage, route sequence compliance, departure delays, and missed delivery points, with filters for specific branches, dates, routes, and drivers.
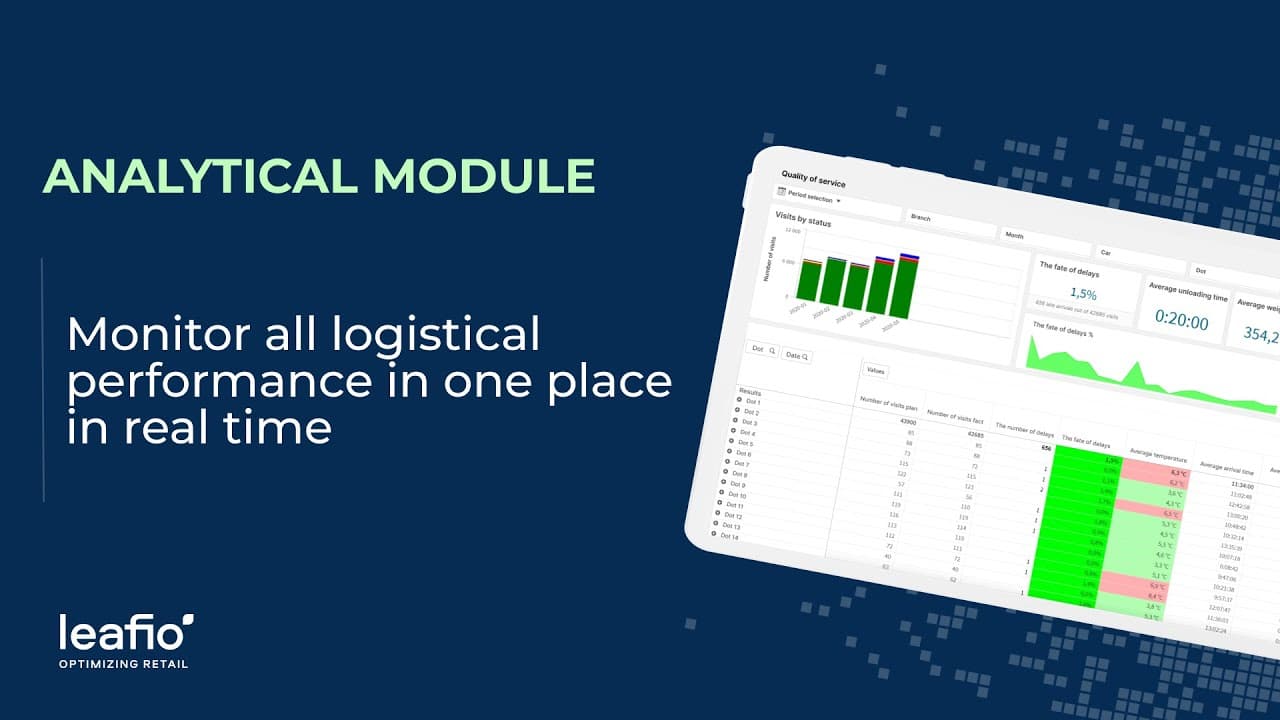
- 4:05The quality-of-service report separates on-time, late, unvisited, and early deliveries and helps determine whether unloading time depends on weight, queues, or other location-specific factors.
- 6:07Customer geography and cost-per-kilogram analysis identify costly delivery points and display their locations and delivery-cost segments on a map.
- 8:08KPI-based driver and branch rankings expose performance problems—the leading driver in the example scores 96—while the unplanned-stops report tracks stop duration and location.